5 Animating/Batching Maps
The benefits of creating maps using a programming language.
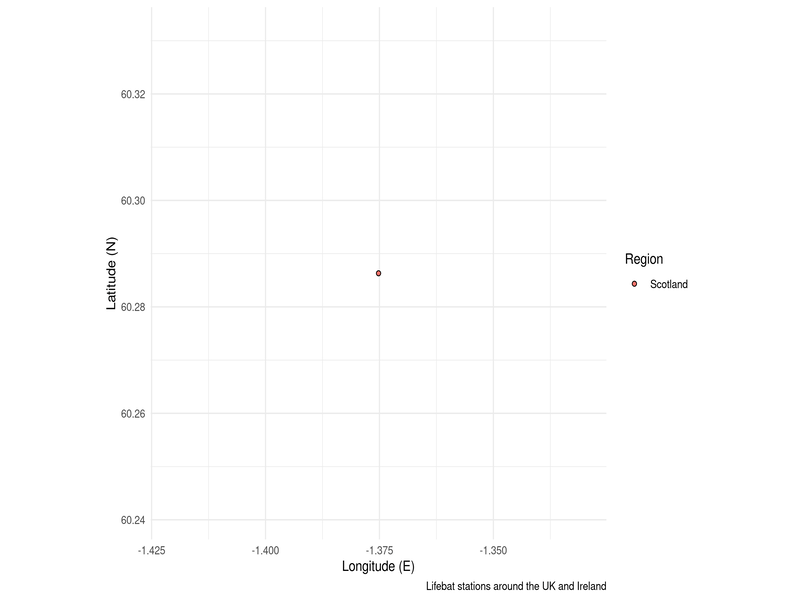
Some people expressed an interest in making animated maps. This is where doing things programmatically starts to shine. All you have to do is iterate and save a different map for each frame in your animation, then stitch them together in order using a gif maker like gifski. Though the code below turns multiple images into an animation, you can use the same principle with the map() function to programmatically produce multiple separate maps. This could be The same map but for different species, or zoomed in to different locations in the world.
RNLI <- read.csv("./Data/RNLI.csv")                                           # Import data from a csv file

map(1:nrow(RNLI), ~{

RNLI_frame <- slice(RNLI, 1:.x)                                               # Get a subset of data to plot

ggplot(RNLI_frame) +                                                          # Use the data to start a plot
  geom_point(aes(X, Y, fill = Region), colour = "black", shape = 21) +        # Make a super simple "map" using points
  theme_minimal() +                                                           # Change appearance to a template
  coord_equal() +                                                             # Set the aspect ratio
  labs(x = "Longitude (E)", y = "Latitude (N)",                               # Add some labels
       caption = "Lifebat stations around the UK and Ireland")

ggsave(str_glue("./Figures/RNLI{.x}.png"))                                    # Save the frame with a unique file name
print(str_glue("{.x}/{nrow(RNLI)}"))
})

# Now stitch the frames into a gif

library(gifski)
gifski(str_glue("./Figures/RNLI{1:nrow(RNLI)}.png"),
       gif_file = "./Figures/animation.gif",
       width = 800, height = 600, delay = 0.1, loop = 1)